20|20
Visualize data in the cab
Data Drives Decisions
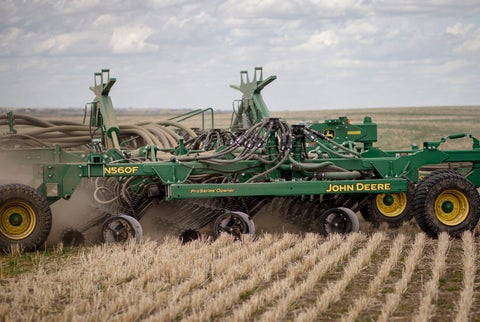
Get real-time data from your air seeder or drill with the 20|20 system.
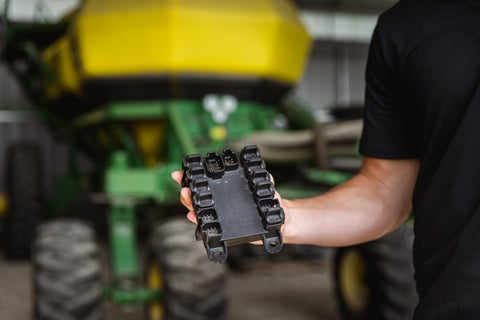
See Inside Your Air Seeder or Drill
Clarity paired with the 20|20 brings complete visibility and understanding to granular product delivery on an air seeder or box drill as it is being applied. By watching the monitor in the cab, you can catch blockage flow issues, drops in pressure or downforce changes the moment they become a problem, rather than after the crop emerges.
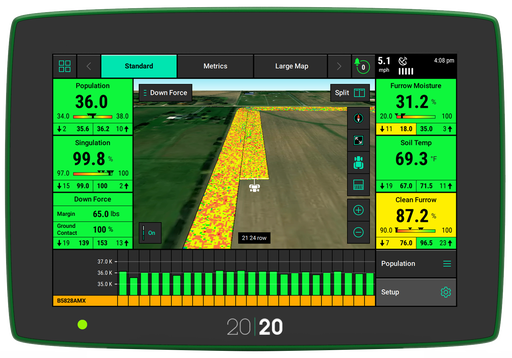
High-Definition Mapping
The 20|20 shows more than just red or green for coverage maps; it shows a vast array of colors in high-definition that illustrates detailed data per row. Monitor flow variability, blockage metrics, downforce, fan speed and air pressure more accurately with the Clarity system.
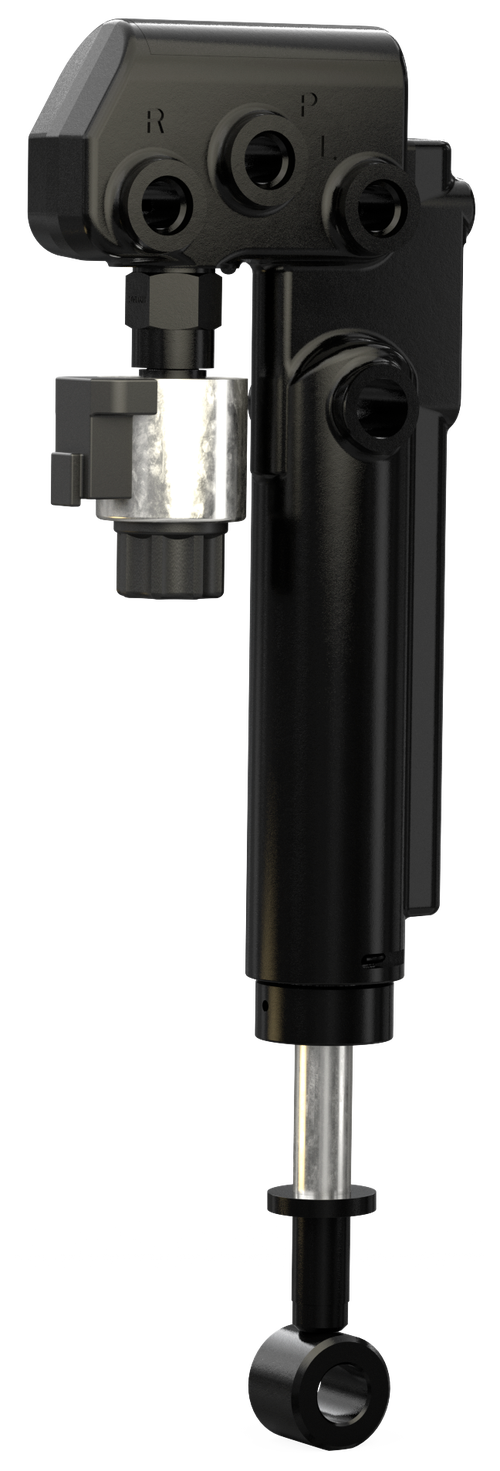
Monitor and Automatically Adjust Downforce With SeederForce
When SeederForce is installed on a John Deere single disk drill, you can use the 20|20 to set the gauge wheel weight you want and the SeederForce system will make automatic downforce adjustments to maintain the desired weight. Monitor and control downforce as you go through the field.
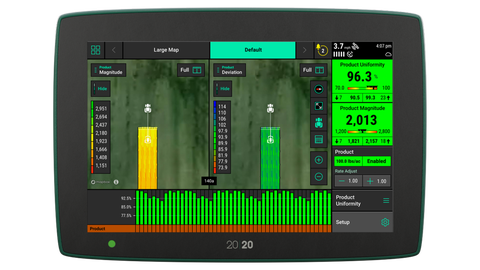
Customize Your View
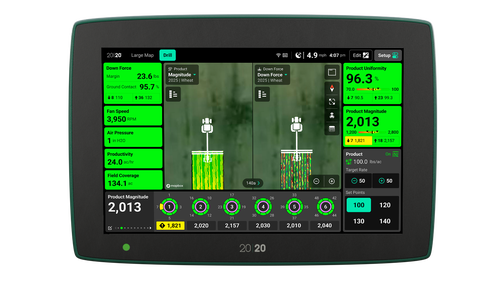
- Product Magnitude: Shows the amount of product flowing through the sensors, giving you a row-by-row comparison. By watching this metric on the 20|20 monitor, you can quickly see any inconsistencies of product flow and investigate issues.
- Product Uniformity: A numerical percentage value that shows how even the system is delivering a product to each row. By using the product magnitude data, the system shows rows that are over-applying or under-applying, in a foot by foot average.
- Product Deviation: Displays how each row compares to the average magnitude being applied. This metric shows the percentage that a row is applying above or below the average.
- Ground Contact + Margin: Confirmation that all rows have enough downforce but not too much to cause excess compaction, provided by SeederForce.
- Summary Information: Once you’re done seeding you can find data for the total acres and seeds planted and total summaries of each product being monitored or controlled through the 20|20. If applicable, you may also find a seeding and liquid downforce summary.
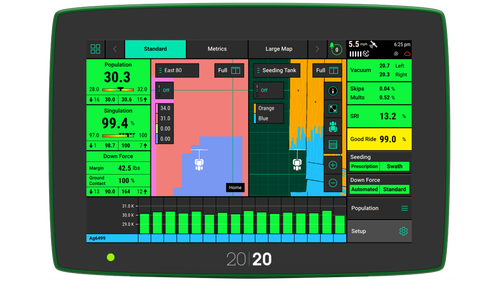
Map
High-definition maps illustrate detailed data per row. Show two maps side by side and product performance.
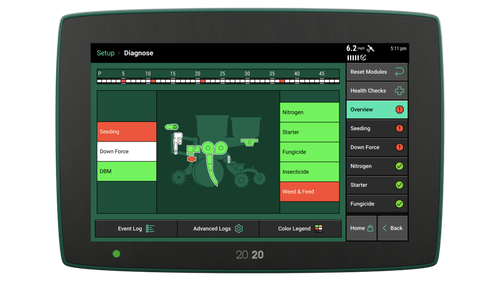
Diagnose
Power and monitor electronic products through the 20|20 to see how they perform in real-time.
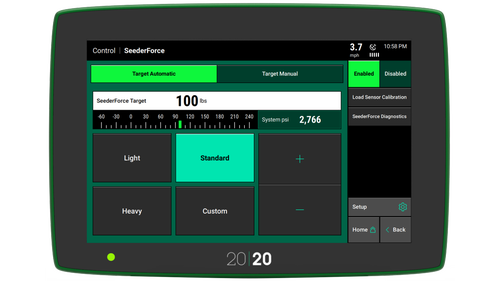
Control
Gain control over your most challenging applications through advanced products and automation capabilities.
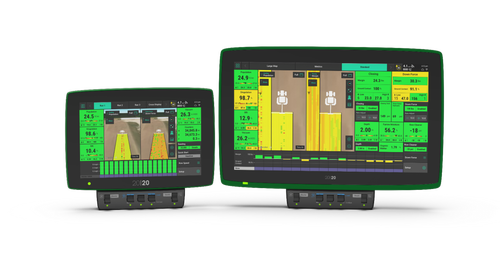
Choose Your Display Size
If you desire to see more metrics and maps side by side on your 20|20, then the 16" display is for you! Two times the widget locations and cross-display control of the most used home-screen features, so you can mount additional displays wherever makes the most sense in your cab.
Data Syncing Across Implements
Share swath coverage and maps across implements working in the same field with Passmaster. Synchronize all maps available on all implements between Gen 3 20|20 systems for the entire field. An annual Panorama subscription is required for this feature.
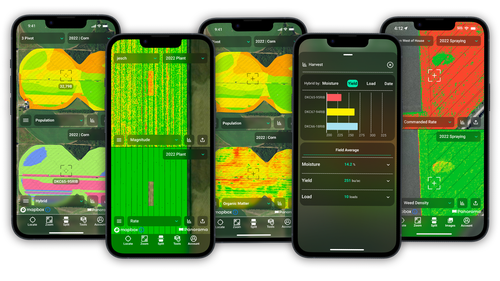
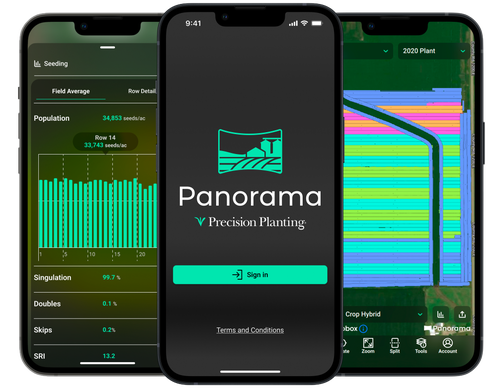
Manage 20|20 maps and data in Panorama™
- View, share, and analyze 20|20 data everywhere.
- See data in row-by-row maps, field average reports, and yield comparisons.
- Automate the process of sending data from your 20|20 to other trusted platforms.
PJ Feldpausch | Michigan
PJ Feldpausch | Michigan
"Before I upgraded with the Clarity system, there was only one sensor out of 10 hoes on my air seeder. I could be planting in one row but have three or four more blocked off. I wouldn't know until it came up, and then I’d have to dig and try to figure out why there weren’t any seeds.
If you want uniformity and to know what you’re actually seeding, you need a system like this. You can see everything that each row is doing. Knowing what I’m seeding and preventing skips makes Clarity a must-have for me."

Alan Wineinger | Farmer
Tribune, KS
Frequently Asked Questions
product resources
20|20 Resources
Find operator guides and watch setup videos here!
20|20 Software Downloads
Download the latest 20|20 software version here!